Network Optimisation

This app calculates optimal solution to a problem involving a network. It may increase profits from your business. Contact us for further details.

The problem: Suppose there is a network of nodes. Each node is linked with a certain number of customers. Nodes are located in a square 25 km x 25 km, which reflects a city. The goal is to visit customers and deliver them physical products. The objective function is a profit.

Assumptions: area 25 km x 25 km, number of nodes 10, average car speed 50 km/h, fuel cost $0.5/km, driver cost $10/h, revenue $2/customer, time needed to serve all customers in a node 0.2 h/mode

Nodes:

ID X Coordinate Y Coordinate Number of Customers
0 1 1 4
1 3 13 18
2 25 15 2
3 17 0 29
4 19 12 15
5 25 25 1
6 24 6 24
7 12 13 9
8 8 22 5
9 10 25 17
Results
Best route for maximum profit: 0 1 7 4 2 6 3 8 9 5
Maximum profit: $161.08
Total revenue: $248.00
Total fuel cost: $47.80
Total driver cost: $39.12
Total distance: 95.60 km
Total time: 3.91 h
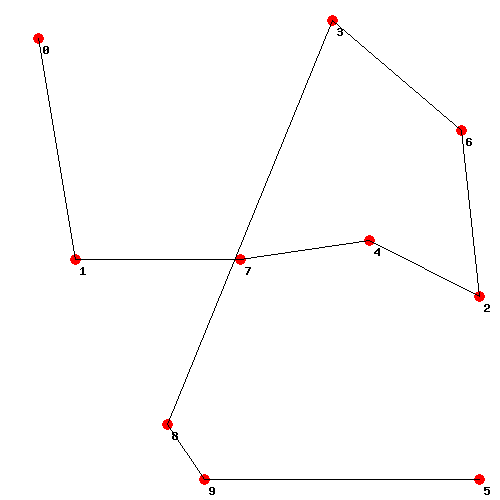
Network graph

Optimal network graph. Case basic: 10 nodes, profit $161.08
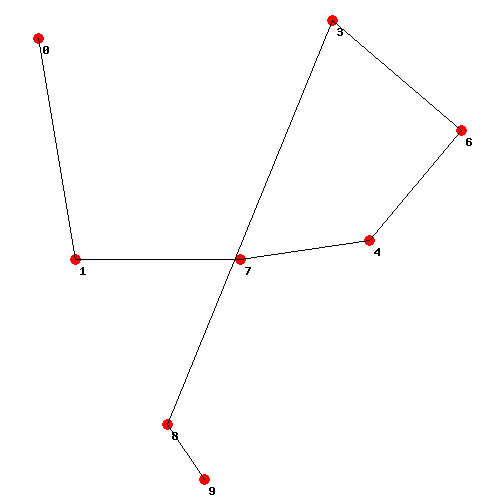
Network graph

Optimal network graph. Case reduced: 8 nodes (excluding nodes 2 and 5), profit $171.15, i.e. + 6.25% vs case basic


Thank You for using this web app!